Starting points...
Don't Make Me Think!
A Pilgram at Tinker Creek
Most people I queried gave very general, linear directions (e.g. I was told to go straight across campus to get to Wurster, Zellerbach, the art museum and the Law School). Only those who seemed well-seasoned attempted to direct me without using generalizations or the outside borders. Conclusion: the campus interior is very difficult to learn and has few well-used, well-known paths. Also, the few people who attempted to direct me to the nearest map utterly failed (I was directed instead to Founder's Rock and the main library).
For this exercise I searched through messages on the newsgroup comp.lang.lisp looking for responses to a question that I had myself at the time: what Windows ports of Lisp are available and where are they? The responses, as the map shows, were plentiful but not always helpful -- a couple were in fact redirections back to sites encouraging the use of Lisp on Linux. Also, some links seemed to act both as nodes (e.g. "the info you want is somewhere below this link") and destinations (e.g. "go to this page to download Lisp"). Thus, on the map a few nodes have destination symbols imbedded in them (destination symbols refer to links to downloadables). Landmarks were places people mentioned as clues without actually providing links (e.g. "Hunt around for Franz and go from there").
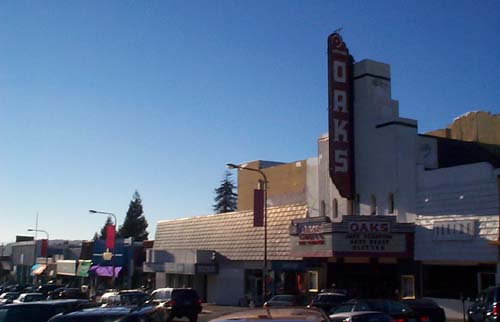
Though I did take a series of photos of Solano Ave. anticipating that I would construct my "atlas" as a collage of buildings, I decided that the raster images included too much clutter -- I only wanted to show the general structure of the street and the appropriate text. So, I instead used the above rough street sketch as a starting point, mapping text onto the general building forms. The project is done in Flash, and you need to use the zoom and drag featues to get the full effect. In one or two zooms you can see car-level signs. Another zoom reveals the pededstrian-level text.
The traffic flow in and out of this particular cafe derives from its situation
at the corner of two streets. The relative size of the flow from the streets (shown as
red paths) reflects the relative size and use of the streets themselves. The two
thickest paths follow the sidewalk on the same side of the street as the cafe. The thinner
vertical lines at the top represent low flow rates from the other side of the major street
and the lone vertical line at the bottom represents low flow rates from the minor street.
As I took a visual survey of South Hall late in the work day, I doubt that my representation
of the connections between rooms is complete. On my chart, red circles indicate hallways,
blue lines are stairs, yellow/orange lines show the elevator system and cross-hatched circles are doors.
Inspired by Ka-Ping Yee's work, I wanted to see how one could represent a
newsgroup thread using animated radial graphs. After scouring the Web, I found Inxight's
Star Tree Studio, which, though designed for site maps, I used to diagram the threads
from project 3. In the graph the name of the contributer
identifies individual messages. When a name appeared more than once, I assigned
it a distinct color. I
also categorized popular sites to which some messages referred using a half-disk above
the node: a red disk above a node means that message referrs to the Corman Lisp page,
a blue disk, the Allegro Lisp page, a green disk, the LispWorks page and a white disk
all of those pages (note that there are no green disks on the graph -- all messages
referring to the LispWorks site also referred to the other two sites). Of note is the
sparsity of the disks, a result of several off-topic sub-threads as well as references to obscure sites.
Click on a node to shift it to the middle of the screen.
I found three different social positions: the imposter,the watchdog and the musician. I also comment on bike chases and enchanted places.
AlphaWorld is what happens when physical space is mapped naively onto virtual space. The result isn't pretty.
During a normal week, most of my travel is between my house in El Cerrito and Soda Hall on Berkeley campus via either bus, BART or bike. As you can see from my world map, even though I have been to only a hand full of countries on the European mainland, I have had my fill. Note on the world map that the intensity of red asterisks indicates the length of my stay in that place (e.g., the darker red asterisks refer to places I have lived; the lighter ones to places I have only visited).
more cafe observations and design considerations
The week's project goes to show you never know what you'll hear when you eavesdrop. Also: A Hubbub-like display for distributed cafes.
narrative and interaction in museums